
InstaCharts In today’s content economy, data is gold, but presenting it can be a significant drag. Small business owners, marketers, and bloggers often face a painful choice: waste hours battling the clunky charting features of spreadsheet software, or subscribe to an expensive, overly complicated Business Intelligence (BI) tool. The result is often charts that look amateurish or come with an unnecessary recurring cost.
Enter InstaCharts. This tool promises to be the low-cost, high-impact solution for creating professional, embeddable data visuals. With its current AppSumo Lifetime Deal (LTD) for a one-time payment of $29, InstaCharts is positioning itself as the specialized, zero-recurring-cost alternative to all-in-one design tools like Canva. We dive deep to see if this focused data visualization app is truly a “must-buy.”
Table of Contents
First Impressions & UI/UX
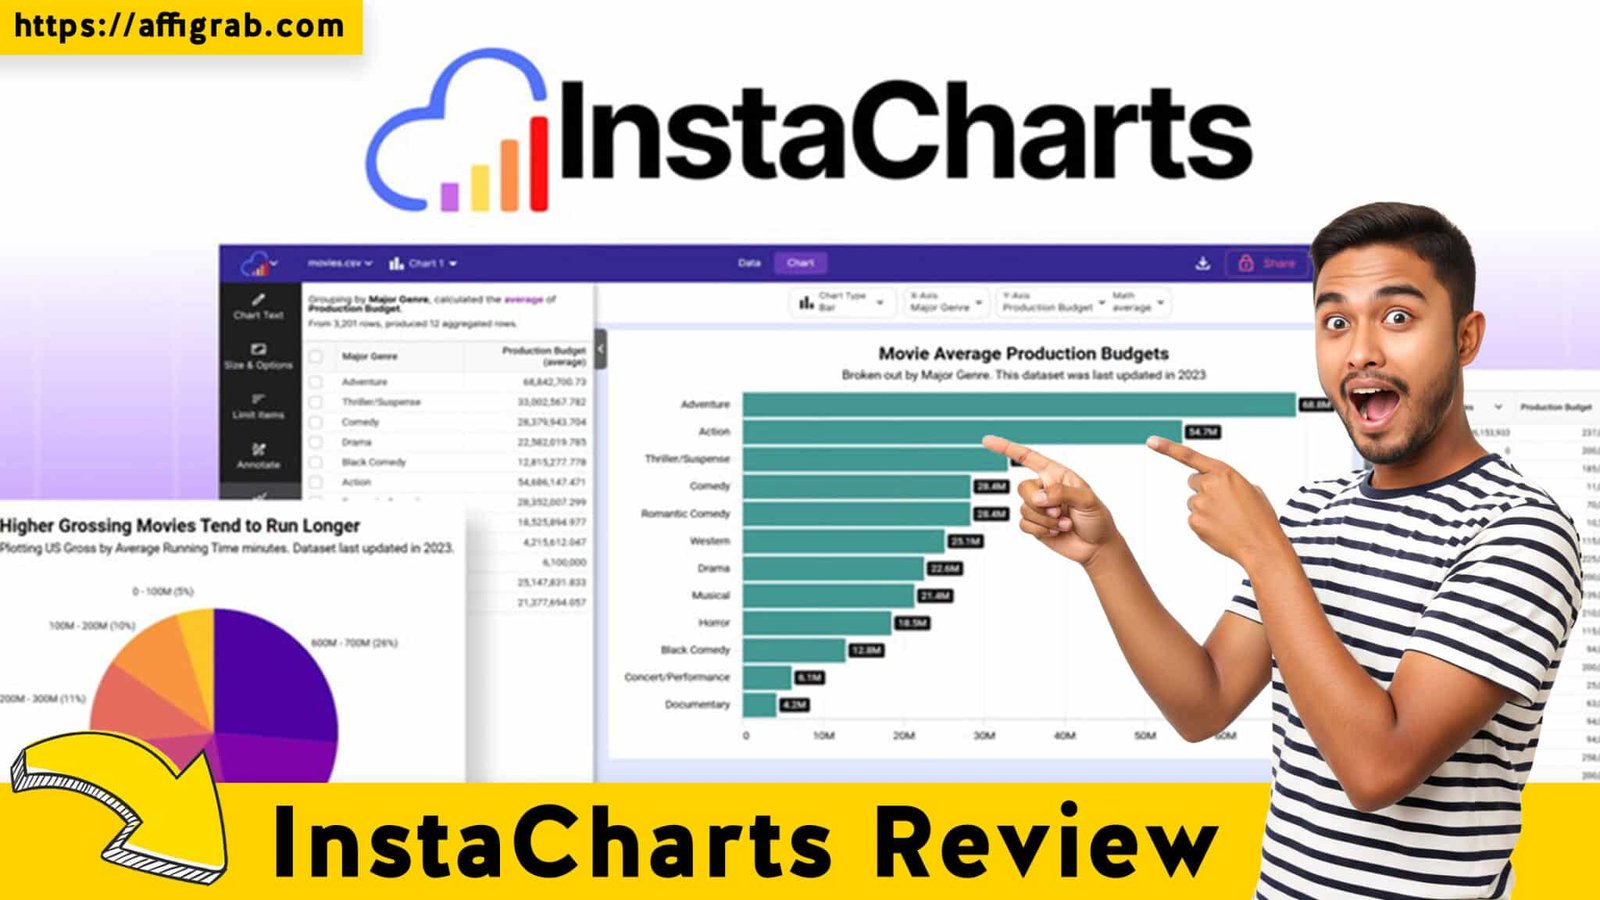
InstaCharts’ user interface (UI) is a masterclass in focused design. Unlike multi-purpose design canvases where charting is just one feature among dozens, InstaCharts is explicitly built for data visualization.
🔥 Click Here to Grab the Lifetime Deal Before it’s Gone!
The initial impression is one of speed and simplicity. The Setup Time is virtually non-existent; you can go from data upload (via CSV, JSON, or Google Sheet link) to a first chart in less than five minutes. The Ease of Navigation is exceptionally high, with the entire workflow centered around a clean, two-panel layout: the Data Panel and the Customization Panel. There is minimal learning curve because the tool removes the clutter of non-chart-related design elements.
Key Design Highlight: Intelligent Data Analysis
The most impressive UX feature is how the main dashboard handles data ingestion. Upon uploading or connecting a data source, InstaCharts doesn’t just display the raw data; it intelligently analyzes the dataset’s structure (e.g., date ranges, numeric values, categorical labels) and automatically recommends the most appropriate chart type. For a non-analyst, this feature is transformative, instantly guiding you away from common visualization mistakes and making the process feel effortless.
Deep Dive into Core Features (Hands-On Analysis)
InstaCharts doesn’t attempt to compete with enterprise BI platforms, but it excels at delivering the features most crucial for content creators and marketers.
Feature Analysis
- Real-time Data Sync (Google Sheets/JSON): This is arguably the most valuable feature. Instead of being a one-off graphic generator, InstaCharts creates a live data link. This is essential for dashboards, ongoing reports, and any visual that requires updates.
- Unlimited Chart & Visual Types: The platform offers a robust library of chart types beyond the basics, including Bar, Line, Pie, Radar, Scatter, Mekko, and Waterfall charts. This variety ensures you can accurately convey almost any standard data relationship.
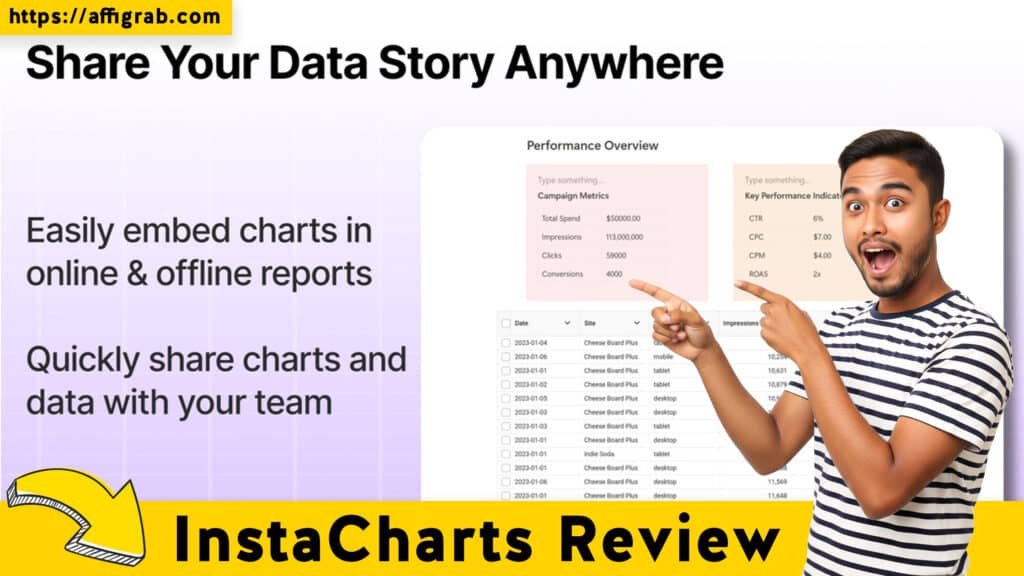
- Export & Embed Options: Charts can be exported as high-resolution PNG files and, critically, as SVG (Scalable Vector Graphics), which is vital for print-quality or high-resolution website graphics without quality loss. For web use, the live iFrame embed is the killer feature.
- Custom Branding & Theming: Users can define and save custom color palettes and fonts to ensure all visuals are 100% on-brand, a feature often locked behind higher-tier subscription plans in competing tools.
🔥 Click Here to Grab the Lifetime Deal Before it’s Gone!
Hands-On Test Case: Sales Data Live Sync & Branding
To test the data synchronization and custom branding power, I executed a specific, practical scenario:
- Setup: I connected InstaCharts to a Google Sheet containing weekly sales figures from our fictional e-commerce store over the last six months.
- Design: I applied a custom brand theme (a specific hex color palette and corporate font) and selected a Line Chart to visualize the sales trend.
- Embedding: I generated the live iFrame embed code and pasted it into a testing environment (a WordPress blog post).7 The resulting chart was immediately visible and professional.
- Test: I then edited the source data in the Google Sheet, increasing the last week’s sales figures by 20%.
Outcome: Within 60 seconds, the embedded Line Chart on the WordPress post automatically updated to reflect the new, higher sales figure. The chart was stunning, mobile-responsive, and high-resolution, and the custom brand colors were perfectly enforced. This confirmed the ‘live sync’ claim and its utility for creating dynamic, data-accurate content without ever touching the embedding code again.
Deal Economics and Market Comparison
The InstaCharts LTD on AppSumo provides an undeniable financial value proposition for solopreneurs and small businesses.
LTD Value Breakdown
The InstaCharts Lifetime Deal is a one-time payment of $29 for access to all Pro features, including live data sync and SVG export.
The primary competitor for quick, high-quality, non-BI-specific visuals is the charting feature within Canva Pro. Canva Pro typically costs $12.99 to $15.00 per month (or $\sim\$120-\$180$ per year).Year 1 Savings Calculation:
- Canva Pro Annual Cost: $\mathbf{\$180.00}$ (at $15/month)
- InstaCharts LTD Cost: 10$\mathbf{\$29.00}$
- Savings in Year 1: $\mathbf{\$151.00}$
- Long-Term Value: After Year 1, the savings are $180 per year, every year, forever. The zero-recurring cost for Pro features that include the crucial real-time syncing makes the LTD an immediate ROI win.
Competitor Comparison: InstaCharts vs. Canva (Charts)
| Feature | InstaCharts (LTD) | Canva (Pro Charts) |
| Primary Focus | Specialized Data Visualization | Multi-purpose Design Suite |
| Real-time Data Sync | YES (Google Sheets, JSON) | Limited/Static (Primarily manual) |
| High-Res Export | PNG, SVG (Vector) | PNG, PDF, JPG (No native live embed) |
| Core Cost | $29 One-Time (LTD) | $15/Month ($\sim\$180$/Year Recurring) |
| Data Analysis UX | Intelligent Auto-Chart Recommendation | Manual Chart Selection |
Who is this LTD Best For?
The InstaCharts LTD is perfect for content creators, agencies, marketers, and bloggers who require fast, data-accurate, and beautifully branded charts that can be embedded and automatically updated across websites and presentations. It’s the ideal tool for those who need a data visualization specialist but do not need the broader design canvas, photo/video editing, or advanced statistical modeling offered by tools like Canva or Tableau.
Final Verdict
🔥 Click Here to Grab the Lifetime Deal Before it’s Gone!
Pros and Cons Table
| Pros ✅ | Cons ❌ |
| True Live Data Sync (Zero manual updates for embedded charts). | Lacks advanced BI/statistical modeling (e.g., forecasting, complex regressions). |
| Specializes in Data Viz only (Cleaner, faster, highly focused UI/UX). | Limited row limit on the basic LTD tier (may require stacking for large datasets). |
| Clean and Intuitive Data Panel (No design distractions, easy data manipulation). | No broader graphic editing features (cannot combine charts with photos/layouts like Canva). |
| SVG Export (Professional, print-quality, scalable graphics). | Embeds are public by default (requires configuration for domain locking). |
| Zero Recurring Cost for Pro Features via LTD. | Reliance on external spreadsheets for data source. |
Final Conclusion
InstaCharts is not a “Canva Killer” in the sense of replacing a full graphic design suite. It’s a Canva Alternative that excels by being a highly specialized, superior data visualization engine. For any solopreneur or small business publishing data-driven content, the ability to create a professional, live-syncing chart in minutes for a zero-recurring, one-time price of $29 is an unparalleled value proposition. It solves a specific, high-value pain point—accurate, beautiful, and updatable data embedding—better and more cost-effectively than any competitor at this price point.The InstaCharts LTD is a Must-Buy for anyone whose primary need is to publish fast, high-quality, and live data visuals.
🔥 Click Here to Grab the Lifetime Deal Before it’s Gone!
Explore Our Pages: WP Themes, WP Plugins
(Affiliate Disclosure: This review contains affiliate links. While the analysis is honest and independent, purchasing through these links supports our work at no extra cost to you.)